
Article
Build stronger relationships with better skip-level meetings
Performance management
14 min read

Written by

Director of People Science Research, Culture Amp
Unpacking the results after an employee survey might seem like a big task. You’ll want to know where to focus your efforts, and if there are any outliers that need special attention. In addition to the main insight report in Culture Amp’s platform that shows the top five questions impacting engagement, many people find the heatmap a useful source of information on where to take action.
The heatmap creates a visual comparison across the entire organization based on demographic groups. It shows you the highs and lows in overall results at a glance. Here we explore common demographics to view within the heatmap and how to interpret the results.
The heatmap shows results by presenting each demographic group as a delta (or difference) from the aggregated scores of the whole company. Demographic groups with the biggest population are presented first because these groups have the greatest influence on the overall score. This also means as you move to groups on the right side of the heatmap, their deltas may be larger due to small sample size.
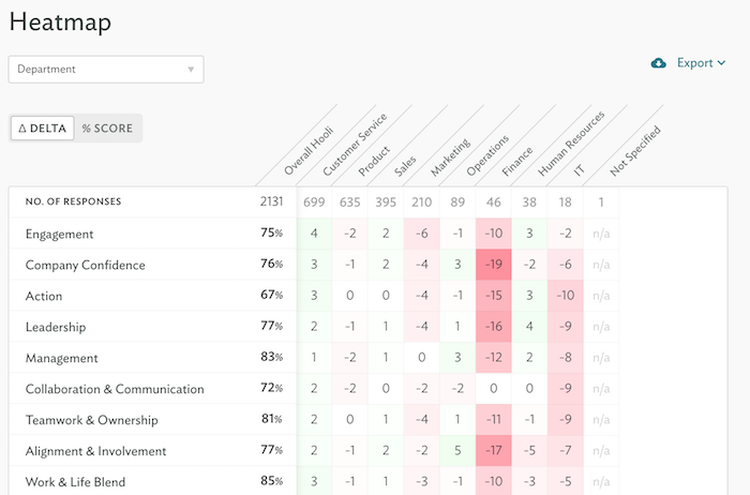
For instance, in the example above, the largest department is Customer Service, with 699 people out of a total of 2,131. Overall engagement at the company is 75%, and the largest negative difference can be found in the Finance department, whose score is 10 points less. This example shows us that there might be something going on with the finance department since their scores are lower across the board.
The ability to see how different groups are doing at a glance is what makes the heatmap so powerful. Brian Christman, previously Senior Vice President of People & Workplace at Etsy, says that his favorite tool within Culture Amp is the heatmap report. He explains, “I find them a quick and easy way to scan the organization and understand where our hot spots or problem areas are.”
This is exactly how Megan Dalessio, Diversity and Inclusion Lead at Box, views the heatmap. She used it to provide an enlightening visual to review inclusion survey results with senior leaders as well as frontline managers. Dalessio showed one manager the heatmap of his office filtered by gender. It showed green (positive experience) for men and red (negative experience) for women. Dalessio says, “You could see he was having an ‘aha moment.’ We were doing a better job of hiring women for that office, but we weren’t creating an inclusive environment for them. For him, to have data on how his employees feel was powerful.”
We've seen department and gender in the examples above, and there are many other demographic groups you can view on the heatmap. The most common demographics we see are:
Department
Job function
Manager
Age
Gender
Tenure
Location
Manager heatmaps are a great way to identify managers that are doing well and managers that could use some help. Gender and age heatmaps give a view of diversity, and tenure heatmaps provide a view of particular cohorts within the company. Location-based heatmaps give insight into whether the culture of a particular location (or remote group) differs from the norm.
There are some companies, like The Motley Fool, who have found great success with custom demographics. Tamsin Green, Project Manager on the Organizational Development Team at Motley Fool, says that business unit, department, and team are three of the most common demographic cuts they use. They’ve worked with over 200 demographics to learn more about their employees and test hypotheses.
Introverted or extrovertedNearly two-thirds of the company have taken the Myers-Briggs assessment to understand if they are more introverted or extroverted. Green says, “It’s continuing to check in and myth-bust theories about introverts and extroverts. Are introverts less or more happy with our open office format? We know the introverts are doing pretty well."
Leadership development programA few years ago, The Motley Fool provided an 18-month leadership development program for selected employees. The People Operations team wanted to understand how the experience affected them. Were they happier? They were, and it turned out the people reporting to those are happier too.
Layers away from senior leadersMotley Fool Founders Tom and David Gardner have a reputation for being open and honest communicators. However, as the company has grown, it’s not possible for them to communicate directly with everyone. This result was very telling, and the team learned that the signal gets diluted as it goes through the organization.
Other companies also find demographics like high potential, performance rating, or sales attainment helpful. These will allow you to easily see if the people you want to keep – high performers – are engaged or disengaged.
We’ve also seen companies use heatmaps to create a more holistic feedback strategy. For example, using results from past employee surveys as demographic groups can give you additional insights. Some common groups would be manager effectiveness rating (from a manager 180 survey), onboarding experience rating (from an onboarding survey), or voluntary exits (from exit surveys). This allows you to view the relationship between, for example, whether teams with a highly effective manager have higher employee engagement.
Interested in learning more about the heatmap or other features within the Culture Amp platform? We'd love to hear from you.


Unlock the 47% advantage: A guide for modern leaders.
Article